
Page 19 - FY 2022-23 Proposed Budget
P. 19
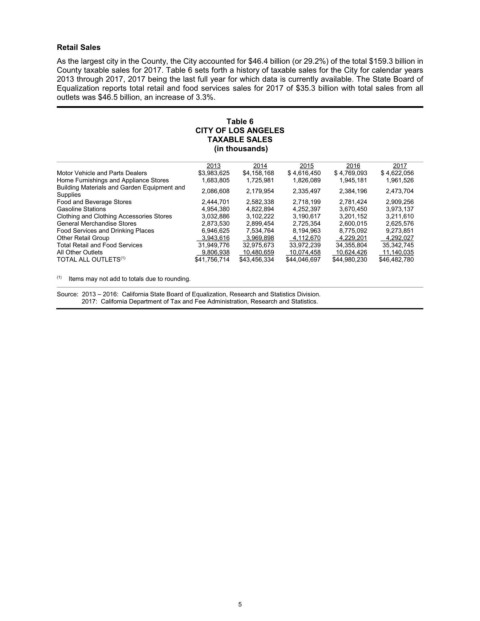
Retail Sales
               As the largest city in the County, the City accounted for $46.4 billion (or 29.2%) of the total $159.3 billion in
               County taxable sales for 2017. Table 6 sets forth a history of taxable sales for the City for calendar years
               2013 through 2017, 2017 being the last full year for which data is currently available. The State Board of
               Equalization reports total retail and food services sales for 2017 of $35.3 billion with total sales from all
               outlets was $46.5 billion, an increase of 3.3%.

                                                           Table 6
                                                   CITY OF LOS ANGELES
                                                      TAXABLE SALES
                                                        (in thousands)

                                                      2013        2014       2015        2016        2017
               Motor Vehicle and Parts Dealers      $3,983,625   $4,158,168   $ 4,616,450   $ 4,769,093   $ 4,622,056
               Home Furnishings and Appliance Stores   1,683,805   1,725,981   1,826,089   1,945,181   1,961,526
               Building Materials and Garden Equipment and
               Supplies                             2,086,608   2,179,954   2,335,497   2,384,196   2,473,704
               Food and Beverage Stores             2,444,701   2,582,338   2,718,199   2,781,424   2,909,256
               Gasoline Stations                    4,954,380   4,822,894   4,252,397   3,670,450   3,973,137
               Clothing and Clothing Accessories Stores   3,032,886   3,102,222   3,190,617   3,201,152   3,211,610
               General Merchandise Stores           2,873,530   2,899,454   2,725,354   2,600,015   2,625,576
               Food Services and Drinking Places    6,946,625   7,534,764   8,194,963   8,775,092   9,273,851
               Other Retail Group                     3,943,616     3,969,898     4,112,670     4,229,201      4,292,027
               Total Retail and Food Services       31,949,776   32,975,673   33,972,239   34,355,804   35,342,745
               All Other Outlets                      9,806,938     10,480,659     10,074,458     10,624,426     11,140,035
               TOTAL ALL OUTLETS                   $41,756,714   $43,456,334   $44,046,697   $44,980,230   $46,482,780
                                (1)

               (1)     Items may not add to totals due to rounding.
               Source:  2013 – 2016:  California State Board of Equalization, Research and Statistics Division.
                        2017:  California Department of Tax and Fee Administration, Research and Statistics.


                                                              5