
Page 497 - 2020-21 Budget Summary
P. 497
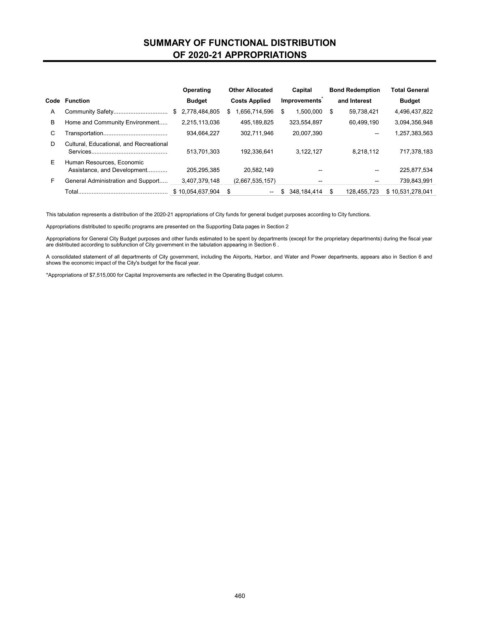
SUMMARY OF FUNCTIONAL DISTRIBUTION
                                           OF 2020-21 APPROPRIATIONS


                                             Operating   Other Allocated  Capital  Bond Redemption  Total General
          Code Function                       Budget     Costs Applied  Improvements *  and Interest  Budget
           A   Community Safety................................ $     2,778,484,805  $     1,656,714,596  $          1,500,000  $           59,738,421         4,496,437,822

           B   Home and Community Environment.....        2,215,113,036           495,189,825        323,554,897               60,499,190         3,094,356,948

           C   Transportation......................................           934,664,227             302,711,946          20,007,390                              --         1,257,383,563

           D   Cultural, Educational, and Recreational


                 Services.............................................           513,701,303           192,336,641            3,122,127                 8,218,112           717,378,183
           E   Human Resources, Economic
                 Assistance, and Development............           205,295,385               20,582,149                          --                              --             225,877,534

            F  General Administration and Support.....        3,407,379,148       (2,667,535,157)                         --                              --             739,843,991
               Total..................................................... $   10,054,637,904  $                         --  $    348,184,414  $         128,455,723  $   10,531,278,041

          This tabulation represents a distribution of the 2020-21 appropriations of City funds for general budget purposes according to City functions.
          Appropriations distributed to specific programs are presented on the Supporting Data pages in Section 2
          Appropriations for General City Budget purposes and other funds estimated to be spent by departments (except for the proprietary departments) during the fiscal year
          are distributed according to subfunction of City government in the tabulation appearing in Section 6 .
          A consolidated statement of all departments of City government, including the Airports, Harbor, and Water and Power departments, appears also in Section 6 and
          shows the economic impact of the City's budget for the fiscal year.
          *Appropriations of $7,515,000 for Capital Improvements are reflected in the Operating Budget column.


                                                          460