Page 46 - FY 2020-21 Revenue Outlook
P. 46

REVENUE MONTHLY STATUS REPORT
                                                Property Tax - Refunds

                                                       (Thousand Dollars)
                              2016-17   2017-18   2018-19                  2019-20                   2020-21
                MONTHLY      ACTUAL     ACTUAL    ACTUAL    BUDGET   ACTUAL    VARIANCE   REVISED  PROPOSED
                JULY      $        (6,457)         (1,168)         (1,341)        (1,340)        (1,402)             (62)        (1,402)        (1,402)
                AUGUST               -          -                (9)             (10)           (287)           (277)           (287)           (287)
                SEPTEMBER            -          -         -        -         -    -           0    -         -
                OCTOBER              -          -         -        -         -    -           0    -         -
                NOVEMBER           (1,060)         (1,128)         (1,510)        (1,510)        (1,812)           (302)        (1,812)        (1,812)
                DECEMBER              (310)            (576)            (243)           (245)           (359)           (114)           (359)           (359)
                JANUARY            (1,102)            (377)            (481)           (480)           (355)            125           (355)           (355)
                FEBRUARY         (10,906)       (11,525)       (14,315)      (14,315)      (11,244)         3,071      (11,244)      (11,244)
                MARCH                 (138)            (226)            (693)           (695)           (297)            398           (297)           (297)
                APRIL                 (194)            (219)            (989)           (990)                 (799)           (799)
                MAY                (2,948)         (2,753)         (3,501)        (3,500)              (3,200)        (3,200)
                JUNE                 -          -         -        -                              -          -

                TOTAL       $       (23,116) $       (17,972)       (23,084) $     (23,085)  $      (19,756) $       (19,755)
                                                $
                % Change        91.7%     -22.3%     28.4%     0.0%                         -14.4%       0.0%
                             2016-17    2017-18   2018-19                  2019-20                   2020-21
                CUMULATIVE   ACTUAL    ACTUAL     ACTUAL   BUDGET    ACTUAL    VARIANCE   REVISED  PROPOSED
                JULY      $        (6,457)         (1,168)         (1,341)        (1,340)        (1,402)             (62)        (1,402)        (1,402)
                AUGUST             (6,457)         (1,168)         (1,350)        (1,350)        (1,689)           (339)        (1,689)        (1,689)
                SEPTEMBER          (6,457)         (1,168)         (1,350)        (1,350)        (1,689)           (339)        (1,689)        (1,689)
                OCTOBER            (6,457)         (1,168)         (1,350)        (1,350)        (1,689)           (339)        (1,689)        (1,689)
                NOVEMBER           (7,517)         (2,295)         (2,861)        (2,860)        (3,501)           (641)        (3,501)        (3,501)
                DECEMBER           (7,827)         (2,872)         (3,104)        (3,105)        (3,860)           (755)        (3,860)        (3,860)
                JANUARY            (8,929)         (3,249)         (3,585)        (3,585)        (4,215)           (630)        (4,215)        (4,215)
                FEBRUARY         (19,835)       (14,774)       (17,900)      (17,900)      (15,459)         2,441      (15,459)      (15,459)
                MARCH            (19,974)       (15,000)       (18,593)      (18,595)      (15,757)         2,838      (15,757)      (15,756)
                APRIL            (20,168)       (15,219)       (19,583)      (19,585)            (16,556)      (16,555)
                MAY              (23,116)       (17,972)       (23,084)      (23,085)            (19,756)      (19,755)
                JUNE             (23,116)       (17,972)       (23,084)      (23,085)            (19,756)      (19,755)
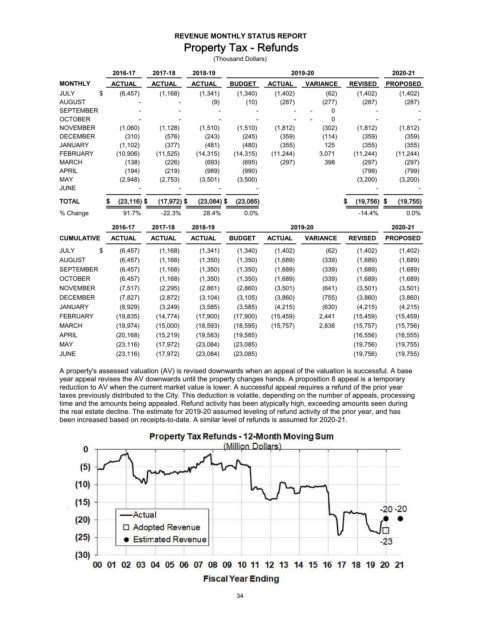
                A property's assessed valuation (AV) is revised downwards when an appeal of the valuation is successful. A base
                year appeal revises the AV downwards until the property changes hands. A proposition 8 appeal is a temporary
                reduction to AV when the current market value is lower. A successful appeal requires a refund of the prior year
                taxes previously distributed to the City. This deduction is volatile, depending on the number of appeals, processing
                time and the amounts being appealed. Refund activity has been atypically high, exceeding amounts seen during
                the real estate decline. The estimate for 2019-20 assumed leveling of refund activity of the prior year, and has
                been increased based on receipts-to-date. A similar level of refunds is assumed for 2020-21.


                                                             34
   41   42   43   44   45   46   47   48   49   50   51