
Page 432 - FY 2020-21 Blue Book Volume II
P. 432
Liability Claims
The following table details liability payouts by department for the last five years:
LIABILITY CLAIMS EXPENDITURES BY DEPARTMENT (in millions)
2014-15 to 2018-19*
Percent of
Department 2014-15 2015-16 2016-17 2017-18 2018-19 Total
Total
Fire $ 6.65 $ 1.31 $ 3.36 $ 1.95 $ 1.05 $ 14.32 2.45%
General Services 0.30 0.46 0.40 0.20 0.00 1.36 0.23%
Police 38.55 70.89 45.64 28.66 35.18 218.92 37.42%
Public Works – Engineering 2.46 0.03 0.28 0.41 1.53 4.71 0.81%
Public Works – Sanitation 1.61 1.13 4.95 5.49 4.83 18.01 3.08%
Public Works – Street Services 5.55 6.87 27.63 16.94 18.02 75.01 12.82%
Recreation and Parks 0.25 6.81 2.36 7.67 7.08 24.17 4.13%
Transportation 1.96 20.20 31.42 25.29 21.42 100.29 17.14%
Various 6.77 1.45 85.33 20.51 14.20 128.26 21.92%
Total $ 64.10 $109.15 $201.37 $107.12 $103.31 $ 585.05 100.00%
* Reflects General Fund and some special fund payouts. The only special fund payouts included are those paid directly by the Bureau of Sanitation
special funds (Solid Waste Resources Revenue Fund, Sewer Operations and Maintenance Fund, and Stormwater Pollution Abatement Fund); payouts
by various other special funds are considered outliers and excluded for the purpose of determining the five-year historical average.
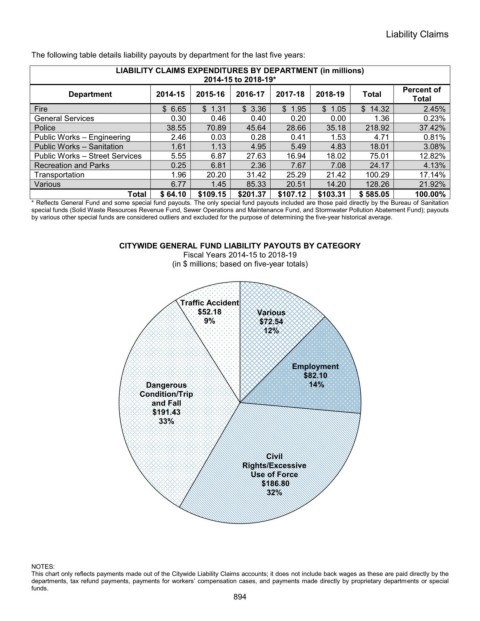
CITYWIDE GENERAL FUND LIABILITY PAYOUTS BY CATEGORY
Fiscal Years 2014-15 to 2018-19
(in $ millions; based on five-year totals)
Traffic Accident
$52.18 Various
9% $72.54
12%
Employment
$82.10
Dangerous 14%
Condition/Trip
and Fall
$191.43
33%
Civil
Rights/Excessive
Use of Force
$186.80
32%
NOTES:
This chart only reflects payments made out of the Citywide Liability Claims accounts; it does not include back wages as these are paid directly by the
departments, tax refund payments, payments for workers’ compensation cases, and payments made directly by proprietary departments or special
funds.
894