
Page 427 - FY 2020-21 Blue Book Volume II
P. 427
Human Resources Benefits
WORKERS' COMPENSATION
SUPPLEMENTAL INFORMATION
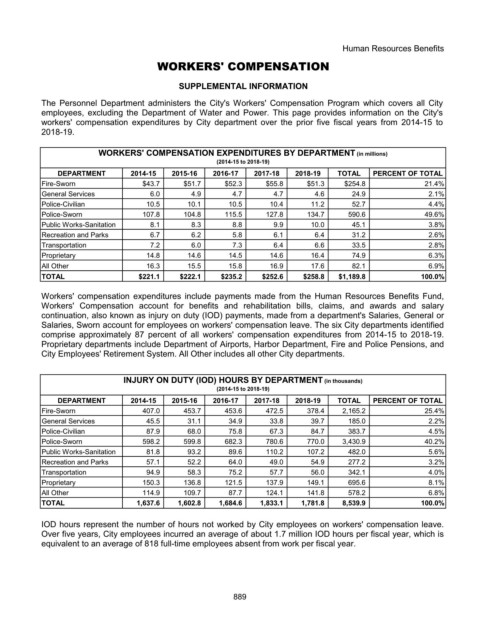
The Personnel Department administers the City's Workers' Compensation Program which covers all City
employees, excluding the Department of Water and Power. This page provides information on the City's
workers' compensation expenditures by City department over the prior five fiscal years from 2014-15 to
2018-19.
WORKERS' COMPENSATION EXPENDITURES BY DEPARTMENT (in millions)
(2014-15 to 2018-19)
DEPARTMENT 2014-15 2015-16 2016-17 2017-18 2018-19 TOTAL PERCENT OF TOTAL
Fire-Sworn $43.7 $51.7 $52.3 $55.8 $51.3 $254.8 21.4%
General Services 6.0 4.9 4.7 4.7 4.6 24.9 2.1%
Police-Civilian 10.5 10.1 10.5 10.4 11.2 52.7 4.4%
Police-Sworn 107.8 104.8 115.5 127.8 134.7 590.6 49.6%
Public Works-Sanitation 8.1 8.3 8.8 9.9 10.0 45.1 3.8%
Recreation and Parks 6.7 6.2 5.8 6.1 6.4 31.2 2.6%
Transportation 7.2 6.0 7.3 6.4 6.6 33.5 2.8%
Proprietary 14.8 14.6 14.5 14.6 16.4 74.9 6.3%
All Other 16.3 15.5 15.8 16.9 17.6 82.1 6.9%
TOTAL $221.1 $222.1 $235.2 $252.6 $258.8 $1,189.8 100.0%
Workers' compensation expenditures include payments made from the Human Resources Benefits Fund,
Workers' Compensation account for benefits and rehabilitation bills, claims, and awards and salary
continuation, also known as injury on duty (IOD) payments, made from a department's Salaries, General or
Salaries, Sworn account for employees on workers' compensation leave. The six City departments identified
comprise approximately 87 percent of all workers' compensation expenditures from 2014-15 to 2018-19.
Proprietary departments include Department of Airports, Harbor Department, Fire and Police Pensions, and
City Employees' Retirement System. All Other includes all other City departments.
INJURY ON DUTY (IOD) HOURS BY DEPARTMENT (in thousands)
(2014-15 to 2018-19)
DEPARTMENT 2014-15 2015-16 2016-17 2017-18 2018-19 TOTAL PERCENT OF TOTAL
Fire-Sworn 407.0 453.7 453.6 472.5 378.4 2,165.2 25.4%
General Services 45.5 31.1 34.9 33.8 39.7 185.0 2.2%
Police-Civilian 87.9 68.0 75.8 67.3 84.7 383.7 4.5%
Police-Sworn 598.2 599.8 682.3 780.6 770.0 3,430.9 40.2%
Public Works-Sanitation 81.8 93.2 89.6 110.2 107.2 482.0 5.6%
Recreation and Parks 57.1 52.2 64.0 49.0 54.9 277.2 3.2%
Transportation 94.9 58.3 75.2 57.7 56.0 342.1 4.0%
Proprietary 150.3 136.8 121.5 137.9 149.1 695.6 8.1%
All Other 114.9 109.7 87.7 124.1 141.8 578.2 6.8%
TOTAL 1,637.6 1,602.8 1,684.6 1,833.1 1,781.8 8,539.9 100.0%
IOD hours represent the number of hours not worked by City employees on workers' compensation leave.
Over five years, City employees incurred an average of about 1.7 million IOD hours per fiscal year, which is
equivalent to an average of 818 full-time employees absent from work per fiscal year.
889