
Page 16 - 2020-21 Budget Summary
P. 16
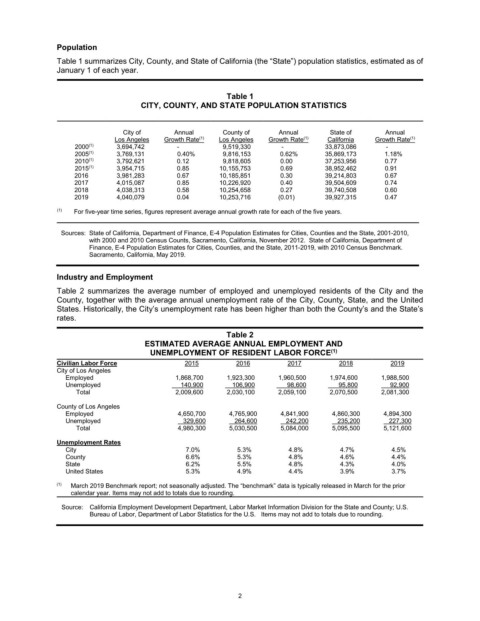
Population
               Table 1 summarizes City, County, and State of California (the “State”) population statistics, estimated as of
               January 1 of each year.


                                                           Table 1
                                     CITY, COUNTY, AND STATE POPULATION STATISTICS


                                City of      Annual       County of     Annual       State of      Annual
                                                                                                          (1)
                              Los Angeles   Growth Rate    Los Angeles   Growth Rate    California   Growth Rate
                                                    (1)
                                                                              (1)
                        (1)
                      2000     3,694,742      -           9,519,330      -          33,873,086     -
                      2005     3,769,131       0.40%      9,816,153     0.62%       35,869,173     1.18%
                        (1)
                      2010     3,792,621      0.12        9,818,605     0.00        37,253,956     0.77
                        (1)
                        (1)
                      2015     3,954,715      0.85       10,155,753     0.69        38,952,462     0.91
                    2016       3,981,283      0.67       10,185,851     0.30        39,214,803     0.67
                    2017       4,015,087      0.85       10,226,920     0.40        39,504,609     0.74
                    2018       4,038,313      0.58       10,254,658     0.27        39,740,508     0.60
                    2019       4,040,079      0.04       10,253,716     (0.01)      39,927,315     0.47
               (1)  For five-year time series, figures represent average annual growth rate for each of the five years.
                Sources:  State of California, Department of Finance, E-4 Population Estimates for Cities, Counties and the State, 2001-2010,
                        with 2000 and 2010 Census Counts, Sacramento, California, November 2012.  State of California, Department of
                        Finance, E-4 Population Estimates for Cities, Counties, and the State, 2011-2019, with 2010 Census Benchmark.
                        Sacramento, California, May 2019.
               Industry and Employment

               Table 2 summarizes the average number of employed and  unemployed residents of the City and the
               County, together with the average annual unemployment rate of the City, County, State, and the United
               States. Historically, the City’s unemployment rate has been higher than both the County’s and the State’s
               rates.
                                                           Table 2
                                      ESTIMATED AVERAGE ANNUAL EMPLOYMENT AND
                                       UNEMPLOYMENT OF RESIDENT LABOR FORCE
                                                                                     (1)
               Civilian Labor Force             2015         2016         2017         2018          2019
               City of Los Angeles
                   Employed                   1,868,700    1,923,300    1,960,500    1,974,600    1,988,500
                   Unemployed                   140,900      106,900       98,600       95,800        92,900
                    Total                     2,009,600    2,030,100    2,059,100    2,070,500    2,081,300
               County of Los Angeles
                   Employed                   4,650,700    4,765,900     4,841,900    4,860,300    4,894,300
                   Unemployed                    329,600      264,600       242,200      235,200      227,300
                    Total                     4,980,300    5,030,500     5,084,000    5,095,500    5,121,600
               Unemployment Rates
                   City                         7.0%         5.3%          4.8%         4.7%         4.5%
                   County                       6.6%         5.3%          4.8%         4.6%         4.4%
                   State                        6.2%         5.5%          4.8%         4.3%         4.0%
                   United States                5.3%         4.9%          4.4%         3.9%         3.7%

               (1)  March 2019 Benchmark report; not seasonally adjusted. The “benchmark” data is typically released in March for the prior
                   calendar year. Items may not add to totals due to rounding.
                 Source:  California Employment Development Department, Labor Market Information Division for the State and County; U.S.
                        Bureau of Labor, Department of Labor Statistics for the U.S.   Items may not add to totals due to rounding.


                                                              2