
Page 17 - 2020-21 Budget Summary
P. 17
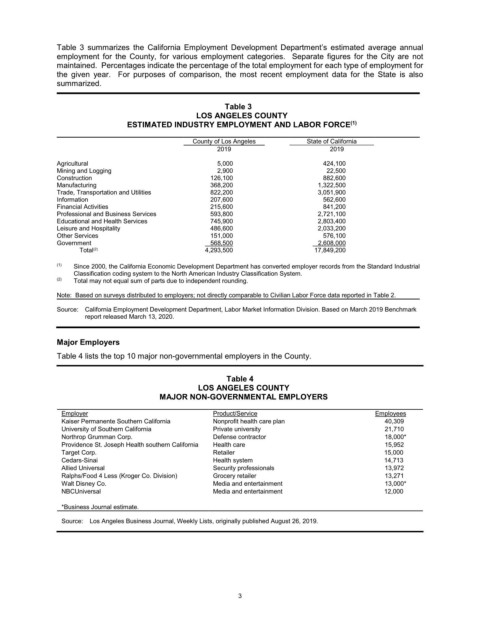
Table  3  summarizes the  California  Employment  Development  Department’s estimated  average annual
               employment  for  the  County,  for various employment categories.    Separate figures for the City are  not
               maintained.  Percentages indicate the percentage of the total employment for each type of employment for
               the given  year.  For purposes of comparison, the  most recent  employment  data  for the State  is also
               summarized.


                                                          Table 3
                                                   LOS ANGELES COUNTY
                                 ESTIMATED INDUSTRY EMPLOYMENT AND LABOR FORCE
                                                                                          (1)
                                                  County of Los Angeles        State of California
                                                        2019                         2019
               Agricultural                             5,000                      424,100
               Mining and Logging                       2,900                       22,500
               Construction                            126,100                     882,600
               Manufacturing                           368,200                    1,322,500
               Trade, Transportation and Utilities     822,200                    3,051,900
               Information                             207,600                     562,600
               Financial Activities                    215,600                     841,200
               Professional and Business Services      593,800                    2,721,100
               Educational and Health Services         745,900                    2,803,400
               Leisure and Hospitality                 486,600                    2,033,200
               Other Services                          151,000                     576,100
               Government                               568,500                     2,608,000
                      Total                          4,293,500                   17,849,200
                         (2)
               (1)  Since 2000, the California Economic Development Department has converted employer records from the Standard Industrial
                    Classification coding system to the North American Industry Classification System.
               (2)  Total may not equal sum of parts due to independent rounding.
               Note:  Based on surveys distributed to employers; not directly comparable to Civilian Labor Force data reported in Table 2.

               Source:  California Employment Development Department, Labor Market Information Division. Based on March 2019 Benchmark
                       report released March 13, 2020.


               Major Employers
               Table 4 lists the top 10 major non-governmental employers in the County.


                                                           Table 4
                                                   LOS ANGELES COUNTY
                                          MAJOR NON-GOVERNMENTAL EMPLOYERS

                 Employer                              Product/Service                           Employees
                 Kaiser Permanente Southern California   Nonprofit health care plan                40,309
                 University of Southern California     Private university                          21,710
                 Northrop Grumman Corp.                Defense contractor                          18,000*
                 Providence St. Joseph Health southern California   Health care                    15,952
                 Target Corp.                          Retailer                                    15,000
                 Cedars-Sinai                          Health system                               14,713
                 Allied Universal                      Security professionals                      13,972
                 Ralphs/Food 4 Less (Kroger Co. Division)   Grocery retailer                       13,271
                 Walt Disney Co.                       Media and entertainment                     13,000*
                 NBCUniversal                          Media and entertainment                     12,000
                 *Business Journal estimate.
                 Source:  Los Angeles Business Journal, Weekly Lists, originally published August 26, 2019.


                                                              3