
Page 477 - 2020-21 Budget Summary
P. 477
Revenue Forecast Report
Discussion
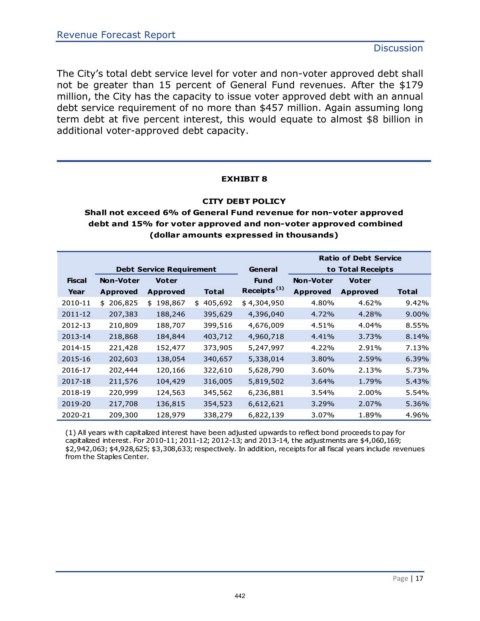
The City’s total debt service level for voter and non-voter approved debt shall
not be greater than 15 percent of General Fund revenues. After the $179
million, the City has the capacity to issue voter approved debt with an annual
debt service requirement of no more than $457 million. Again assuming long
term debt at five percent interest, this would equate to almost $8 billion in
additional voter-approved debt capacity.
EXHIBIT 8
CITY DEBT POLICY
Shall not exceed 6% of General Fund revenue for non-voter approved
debt and 15% for voter approved and non-voter approved combined
(dollar amounts expressed in thousands)
Ratio of Debt Service
Debt Service Requirement General to Total Receipts
Fiscal Non-Voter Voter Fund Non-Voter Voter
Year Approved Approved Total Receipts (1) Approved Approved Total
2010-11 $ 206,825 $ 198,867 $ 405,692 $ 4,304,950 4.80% 4.62% 9.42%
2011-12 207,383 188,246 395,629 4,396,040 4.72% 4.28% 9.00%
2012-13 210,809 188,707 399,516 4,676,009 4.51% 4.04% 8.55%
2013-14 218,868 184,844 403,712 4,960,718 4.41% 3.73% 8.14%
2014-15 221,428 152,477 373,905 5,247,997 4.22% 2.91% 7.13%
2015-16 202,603 138,054 340,657 5,338,014 3.80% 2.59% 6.39%
2016-17 202,444 120,166 322,610 5,628,790 3.60% 2.13% 5.73%
2017-18 211,576 104,429 316,005 5,819,502 3.64% 1.79% 5.43%
2018-19 220,999 124,563 345,562 6,236,881 3.54% 2.00% 5.54%
2019-20 217,708 136,815 354,523 6,612,621 3.29% 2.07% 5.36%
2020-21 209,300 128,979 338,279 6,822,139 3.07% 1.89% 4.96%
(1) All years with capitalized interest have been adjusted upwards to reflect bond proceeds to pay for
capitalized interest. For 2010-11; 2011-12; 2012-13; and 2013-14, the adjustments are $4,060,169;
$2,942,063; $4,928,625; $3,308,633; respectively. In addition, receipts for all fiscal years include revenues
from the Staples Center.
Page | 17
442