
Page 78 - FY 2022-23 Revenue Outlook
P. 78
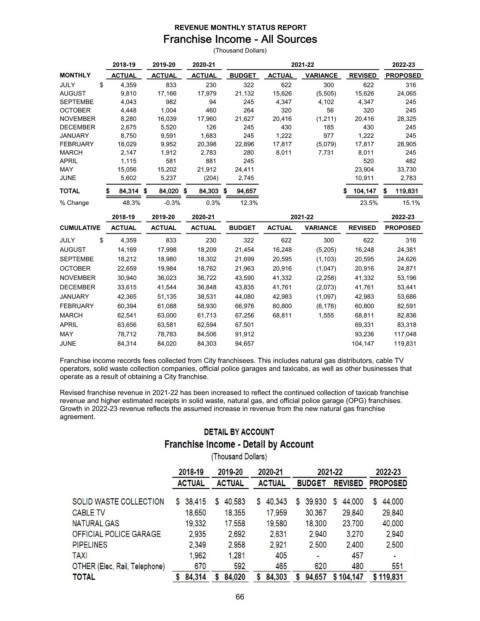
REVENUE MONTHLY STATUS REPORT
                                           Franchise Income - All Sources
                                                       (Thousand Dollars)

                              2018-19   2019-20   2020-21                  2021-22                   2022-23
                MONTHLY      ACTUAL     ACTUAL    ACTUAL    BUDGET   ACTUAL    VARIANCE   REVISED  PROPOSED
                JULY      $         4,359            833            230           322           622           300           622           316
                AUGUST              9,810        17,166        17,979      21,132      15,626       (5,505)      15,626      24,065
                SEPTEMBE            4,043            982              94           245        4,347        4,102        4,347           245
                OCTOBER             4,448          1,004            460           264           320             56           320           245
                NOVEMBER            8,280        16,039        17,960      21,627      20,416       (1,211)      20,416      28,325
                DECEMBER            2,675          5,520            126           245           430           185           430           245
                JANUARY             8,750          9,591          1,683           245        1,222           977        1,222           245
                FEBRUARY          18,029          9,952        20,398      22,896      17,817       (5,079)      17,817      28,905
                MARCH               2,147          1,912          2,783           280        8,011        7,731        8,011           245
                APRIL               1,115            581            881           245                 520           482
                MAY               15,056        15,202        21,912      24,411              23,904      33,730
                JUNE                5,602          5,237           (204)        2,745            10,911        2,783
                TOTAL       $       84,314 $        84,020 $        84,303 $      94,657  $     104,147  $      119,831
                % Change        48.3%      -0.3%      0.3%    12.3%                          23.5%      15.1%
                             2018-19    2019-20   2020-21                  2021-22                   2022-23
                CUMULATIVE   ACTUAL    ACTUAL     ACTUAL   BUDGET    ACTUAL    VARIANCE   REVISED  PROPOSED
                JULY      $         4,359            833            230           322           622           300           622           316
                AUGUST            14,169        17,998        18,209      21,454      16,248       (5,205)      16,248      24,381
                SEPTEMBE          18,212        18,980        18,302      21,699      20,595       (1,103)      20,595      24,626
                OCTOBER           22,659        19,984        18,762      21,963      20,916       (1,047)      20,916      24,871
                NOVEMBER          30,940        36,023        36,722      43,590      41,332       (2,258)      41,332      53,196
                DECEMBER          33,615        41,544        36,848      43,835      41,761       (2,073)      41,761      53,441
                JANUARY           42,365        51,135        38,531      44,080      42,983       (1,097)      42,983      53,686
                FEBRUARY          60,394        61,088        58,930      66,976      60,800       (6,176)      60,800      82,591
                MARCH             62,541        63,000        61,713      67,256      68,811        1,555      68,811      82,836
                APRIL             63,656        63,581        62,594      67,501              69,331      83,318
                MAY               78,712        78,783        84,506      91,912              93,236    117,048
                JUNE              84,314        84,020        84,303      94,657            104,147    119,831

                Franchise income records fees collected from City franchisees. This includes natural gas distributors, cable TV
                operators, solid waste collection companies, official police garages and taxicabs, as well as other businesses that
                operate as a result of obtaining a City franchise.

                Revised franchise revenue in 2021-22 has been increased to reflect the continued collection of taxicab franchise
                revenue and higher estimated receipts in solid waste, natural gas, and official police garage (OPG) franchises.
                Growth in 2022-23 revenue reflects the assumed increase in revenue from the new natural gas franchise
                agreement.
                                                     DETAIL BY ACCOUNT
                                           Franchise Income - Detail by Account
                                                       (Thousand Dollars)

                                               2018-19   2019-20   2020-21        2021-22        2022-23
                                              ACTUAL    ACTUAL     ACTUAL    BUDGET  REVISED  PROPOSED


                   SOLID WASTE COLLECTION     $  38,415  $  40,583   $  40,343  $  39,930  $  44,000  $  44,000
                   CABLE TV                     18,650    18,355     17,959    30,367   29,840     29,840
                   NATURAL GAS                  19,332    17,558     19,580    18,300   23,700     40,000
                   OFFICIAL POLICE GARAGE        2,935     2,692      2,631     2,940    3,270      2,940
                   PIPELINES                     2,349     2,958      2,921     2,500    2,400      2,500
                   TAXI                          1,962     1,281       405                 457
                   OTHER (Elec, Rail, Telephone)   670       592       465       620       480       551
                   TOTAL                      $  84,314  $  84,020  $  84,303  $  94,657  $104,147  $119,831

                                                             66