
Page 79 - FY 2022-23 Revenue Outlook
P. 79
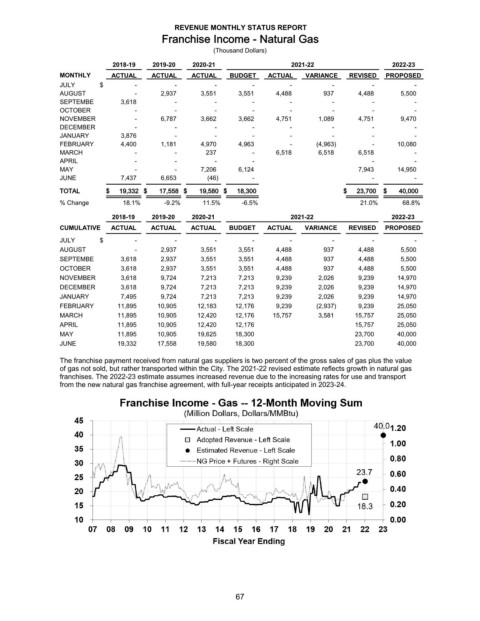
REVENUE MONTHLY STATUS REPORT
                                          Franchise Income - Natural Gas
                                                       (Thousand Dollars)

                              2018-19   2019-20   2020-21                  2021-22                   2022-23
                MONTHLY      ACTUAL     ACTUAL    ACTUAL    BUDGET   ACTUAL    VARIANCE   REVISED  PROPOSED
                JULY      $         -         -         -         -         -         -          -         -
                AUGUST              -            2,937          3,551        3,551        4,488           937        4,488        5,500
                SEPTEMBE            3,618     -         -         -         -         -          -         -
                OCTOBER             -         -         -         -         -         -          -         -
                NOVEMBER            -            6,787          3,662        3,662        4,751        1,089        4,751        9,470
                DECEMBER            -         -         -         -         -         -          -         -
                JANUARY             3,876     -         -         -         -         -          -         -
                FEBRUARY            4,400          1,181          4,970        4,963   -         (4,963)   -        10,080
                MARCH               -         -              237   -          6,518        6,518        6,518   -
                APRIL               -         -         -         -                              -         -
                MAY                 -         -            7,206        6,124                   7,943      14,950
                JUNE                7,437          6,653             (46)   -                    -         -
                TOTAL       $       19,332 $        17,558 $        19,580 $      18,300  $       23,700  $       40,000
                % Change        18.1%      -9.2%     11.5%     -6.5%                         21.0%      68.8%
                              2018-19   2019-20   2020-21                  2021-22                   2022-23
                CUMULATIVE   ACTUAL    ACTUAL     ACTUAL   BUDGET    ACTUAL    VARIANCE   REVISED  PROPOSED
                JULY      $         -         -         -         -         -         -          -         -
                AUGUST              -            2,937          3,551        3,551        4,488           937        4,488        5,500
                SEPTEMBE            3,618          2,937          3,551        3,551        4,488           937        4,488        5,500
                OCTOBER             3,618          2,937          3,551        3,551        4,488           937        4,488        5,500
                NOVEMBER            3,618          9,724          7,213        7,213        9,239        2,026        9,239      14,970
                DECEMBER            3,618          9,724          7,213        7,213        9,239        2,026        9,239      14,970
                JANUARY             7,495          9,724          7,213        7,213        9,239        2,026        9,239      14,970
                FEBRUARY          11,895        10,905        12,183      12,176        9,239       (2,937)        9,239      25,050
                MARCH             11,895        10,905        12,420      12,176      15,757        3,581      15,757      25,050
                APRIL             11,895        10,905        12,420      12,176              15,757      25,050
                MAY               11,895        10,905        19,625      18,300              23,700      40,000
                JUNE              19,332        17,558        19,580      18,300              23,700      40,000

                The franchise payment received from natural gas suppliers is two percent of the gross sales of gas plus the value
                of gas not sold, but rather transported within the City. The 2021-22 revised estimate reflects growth in natural gas
                franchises. The 2022-23 estimate assumes increased revenue due to the increasing rates for use and transport
                from the new natural gas franchise agreement, with full-year receipts anticipated in 2023-24.


                                                             67