
Page 75 - FY 2022-23 Revenue Outlook
P. 75
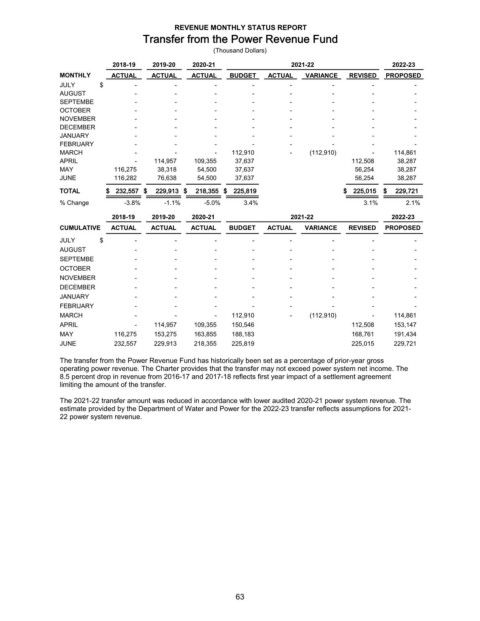
REVENUE MONTHLY STATUS REPORT
                                     Transfer from the Power Revenue Fund
                                                       (Thousand Dollars)

                              2018-19   2019-20   2020-21                  2021-22                   2022-23
                MONTHLY      ACTUAL     ACTUAL    ACTUAL    BUDGET   ACTUAL    VARIANCE   REVISED  PROPOSED
                JULY      $         -         -         -         -        -          -          -         -
                AUGUST              -         -         -         -        -          -          -         -
                SEPTEMBE            -         -         -         -        -          -          -         -
                OCTOBER             -         -         -         -        -          -          -         -
                NOVEMBER            -         -         -         -        -          -          -         -
                DECEMBER            -         -         -         -        -          -          -         -
                JANUARY             -         -         -         -        -          -          -         -
                FEBRUARY            -         -         -         -        -          -          -         -
                MARCH               -         -         -      112,910     -     (112,910)       -      114,861
                APRIL               -        114,957      109,355      37,637               112,508      38,287
                MAY             116,275        38,318        54,500      37,637               56,254      38,287
                JUNE            116,282        76,638        54,500      37,637               56,254      38,287
                TOTAL       $      232,557 $      229,913 $      218,355 $    225,819    $     225,015  $      229,721
                % Change         -3.8%     -1.1%     -5.0%     3.4%                           3.1%       2.1%
                             2018-19    2019-20   2020-21                  2021-22                   2022-23
                CUMULATIVE   ACTUAL    ACTUAL     ACTUAL   BUDGET    ACTUAL    VARIANCE   REVISED  PROPOSED
                JULY      $         -         -         -         -        -          -          -         -
                AUGUST              -         -         -         -        -          -          -         -
                SEPTEMBE            -         -         -         -        -          -          -         -
                OCTOBER             -         -         -         -        -          -          -         -
                NOVEMBER            -         -         -         -        -          -          -         -
                DECEMBER            -         -         -         -        -          -          -         -
                JANUARY             -         -         -         -        -          -          -         -
                FEBRUARY            -         -         -         -        -          -          -         -
                MARCH               -         -         -      112,910     -     (112,910)       -      114,861
                APRIL               -        114,957      109,355    150,546                112,508    153,147
                MAY             116,275      153,275      163,855    188,183                168,761    191,434
                JUNE            232,557      229,913      218,355    225,819                225,015    229,721

                The transfer from the Power Revenue Fund has historically been set as a percentage of prior-year gross
                operating power revenue. The Charter provides that the transfer may not exceed power system net income. The
                8.5 percent drop in revenue from 2016-17 and 2017-18 reflects first year impact of a settlement agreement
                limiting the amount of the transfer.
                The 2021-22 transfer amount was reduced in accordance with lower audited 2020-21 power system revenue. The

                estimate provided by the Department of Water and Power for the 2022-23 transfer reflects assumptions for 2021-
                22 power system revenue.


                                                             63