
Page 190 - FY 2022-23 Supporting Information
P. 190
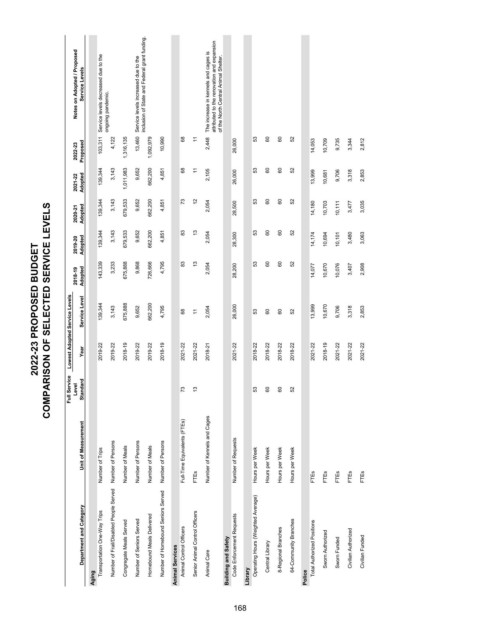
Notes on Adopted / Proposed  Service Levels  Service levels decreased due to the   ongoing pandemic.  Service levels increased due to the  inclusion of State and Federal grant funding.  The increase in kennels and cages is  attributed to the renovation and expansion  of the North Central Animal Shelter.


                     2022-23   Proposed  103,311  4,122      1,316,135            13,460       1,092,979            10,990   68  11             2,448            26,000                   53                   60                   60                   52              14,053            10,709              9,735              3,344              2,812


                     2021-22   Adopted   139,344  3,143      1,011,983              9,652          662,200              4,851   68  11             2,105            26,000                   53                   60                   60                   52            13,999            10,681              9,706              3,318              2,853


              COMPARISON OF SELECTED SERVICE LEVELS
                     2020-21   Adopted  139,344  3,143         679,533              9,652          662,200              4,851   73  12             2,054            28,500                   53                   60                   60                   52            14,180            10,703            10,111              3,477              3,035


                     2019-20   Adopted  139,344  3,143         679,533              9,652          662,200              4,851   83  13             2,054            28,300                   53                   60                   60                   52            14,174            10,694            10,101              3,480              3,063
            2022-23 PROPOSED BUDGET


                     2018-19  Adopted  143,339  3,233         675,888              9,868          726,666              4,795   83  13             2,054            28,200                   53                   60                   60                   52            14,077            10,670            10,076              3,407              2,908


                   Lowest Adopted Service Levels  Service Level  Year  139,344  2019-22  3,143  2019-22  675,888  2018-19  9,652  2019-22  662,200  2019-22  4,795  2018-19  68  2021-22  11  2021-22  2,054  2018-21  26,000  2021-22  53  2018-22  60  2018-22  60  2018-22  52  2018-22  13,999  2021-22  10,670  2018-19  9,706  2021-22  3,318  2021-22  2,853  2021-22


                   Full Service   Level   Standard  73  13        53  60  60  52


                      Unit of Measurement  Number of Trips  Number of Persons  Number of Meals  Number of Persons  Number of Meals  Number of Persons  Full-Time Equivalents (FTEs)  FTEs  Number of Kennels and Cages  Number of Requests  Hours per Week  Hours per Week  Hours per Week  Hours per Week  FTEs  FTEs  FTEs  FTEs  FTEs


                      Department and Category  Transportation One-Way Trips Number of Frail/Disabled People Served  Congregate Meals Served  Number of Seniors Served  Homebound Meals Delivered Number of Homebound Seniors Served  Animal Control Officers  Senior Animal Control Officers  Code Enforcement Requests  Operating Hours (Weighted Average)  Central Library  8-Regional Branches  64-Community Branches   Total Authorized Positions  Sworn Authorized  Sworn Funded  Civilian Authoriz


                         Aging                Animal Services  Animal Care  Building and Safety  Library  Police


                                                             168