
Page 191 - FY 2022-23 Supporting Information
P. 191
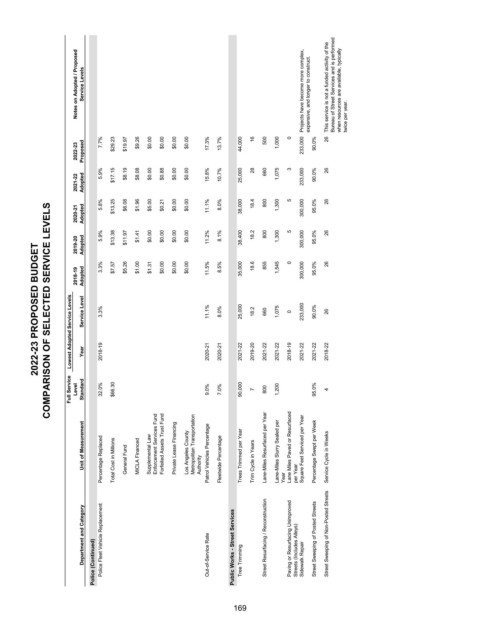
Notes on Adopted / Proposed  Service Levels              Projects have become more complex,  expensive, and longer to construct.  This service is not a funded activity of the  Bureau of Street Services and is performed  when resources are available, typically   twice per year.


                     2022-23   Proposed  7.7%  $29.23  $19.97  $9.26  $0.00  $0.00  $0.00  $0.00  17.3%  13.7%           44,000   16                500              1,000   0         233,000   90.0%  26


                     2021-22   Adopted   5.9%  $17.15  $8.19  $8.08  $0.00  $0.88  $0.00  $0.00  15.8%  10.7%           25,000   28                660              1,075   3         233,000   90.0%  26


              COMPARISON OF SELECTED SERVICE LEVELS
                     2020-21   Adopted  5.8%  $13.25  $6.08  $1.96  $5.00  $0.21  $0.00  $0.00  11.1%  8.0%           38,000   18.4                800              1,300   5         300,000   95.0%  26


                     2019-20   Adopted  5.9%  $13.38  $11.97  $1.41  $0.00  $0.00  $0.00  $0.00  11.2%  8.1%           38,400   18.2                800              1,300   5         300,000   95.0%  26
            2022-23 PROPOSED BUDGET


                     2018-19  Adopted  3.3%  $7.57  $5.26  $1.00  $1.31  $0.00  $0.00  $0.00  11.5%  8.5%           35,000   18.6                855              1,545   0         300,000   95.0%  26


                   Lowest Adopted Service Levels  Service Level  Year  3.3%  2018-19  11.1%  2020-21  8.0%  2020-21  25,000  2021-22  18.2  2019-20  660  2021-22  1,075  2021-22  0  2018-19  233,000  2021-22  90.0%  2021-22  26  2018-22


                   Full Service   Level   Standard  32.0%  $66.30  9.0%  7.0%  90,000  7  800  1,200  95.0%  4


                      Unit of Measurement  Percentage Replaced  Total Cost in Millions  General Fund  MICLA Financed  Supplemental Law                    Enforcement Services Fund Forfeited Assets Trust Fund  Private Lease Financing  Los Angeles County  Metropolitan Transportation   Authority  Patrol Vehicles Percentage  Fleetwide Percentage  Trees Trimmed per Year  Trim Cycle in Years  Lane-Miles Resurfaced per Year  Lane-Miles Slurry Sealed per   Year Lane Miles Paved or Resurfaced


                      Department and Category  Police (Continued) Police Fleet Vehicle Replacement  Out-of-Service Rate  Public Works - Street Services  Tree Trimming  Street Resurfacing / Reconstruction  Paving or Resurfacing Unimproved   Streets (Includes Alleys)  Sidewalk Repair  Street Sweeping of Posted Streets Street Sweeping of Non-Posted Streets


                                                             169