
Page 31 - FY 2022-23 Proposed Budget
P. 31
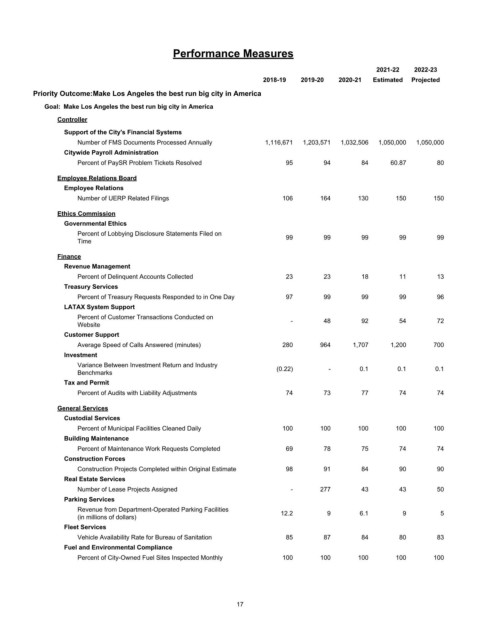
Performance Measures

                                                                                                 2021-22   2022-23
                                                                    2018-19   2019-20  2020-21  Estimated  Projected
         Priority Outcome:Make Los Angeles the best run big city in America
            Goal:  Make Los Angeles the best run big city in America

                Controller
                 Support of the City's Financial Systems
                     Number of FMS Documents Processed Annually      1,116,671  1,203,571  1,032,506  1,050,000  1,050,000
                 Citywide Payroll Administration
                     Percent of PaySR Problem Tickets Resolved            95        94       84      60.87       80
                Employee Relations Board
                 Employee Relations
                     Number of UERP Related Filings                      106       164      130       150       150

                Ethics Commission
                 Governmental Ethics
                     Percent of Lobbying Disclosure Statements Filed on
                                                                          99        99       99        99        99
                     Time
                Finance
                 Revenue Management
                     Percent of Delinquent Accounts Collected             23        23       18        11        13
                 Treasury Services
                     Percent of Treasury Requests Responded to in One Day  97       99       99        99        96
                 LATAX System Support
                     Percent of Customer Transactions Conducted on         -        48       92        54        72
                     Website
                 Customer Support
                     Average Speed of Calls Answered (minutes)           280       964     1,707     1,200      700
                 Investment
                     Variance Between Investment Return and Industry    (0.22)       -       0.1      0.1       0.1
                     Benchmarks
                 Tax and Permit
                     Percent of Audits with Liability Adjustments         74        73       77        74        74

                General Services
                 Custodial Services
                     Percent of Municipal Facilities Cleaned Daily       100       100      100       100       100
                 Building Maintenance
                     Percent of Maintenance Work Requests Completed       69        78       75        74        74
                 Construction Forces
                     Construction Projects Completed within Original Estimate  98   91       84        90        90
                 Real Estate Services
                     Number of Lease Projects Assigned                     -       277       43        43        50
                 Parking Services
                     Revenue from Department-Operated Parking Facilities  12.2      9        6.1        9        5
                     (in millions of dollars)
                 Fleet Services
                     Vehicle Availability Rate for Bureau of Sanitation   85        87       84        80        83
                 Fuel and Environmental Compliance
                     Percent of City-Owned Fuel Sites Inspected Monthly  100       100      100       100       100


                                                             17