
Page 34 - FY 2022-23 Proposed Budget
P. 34
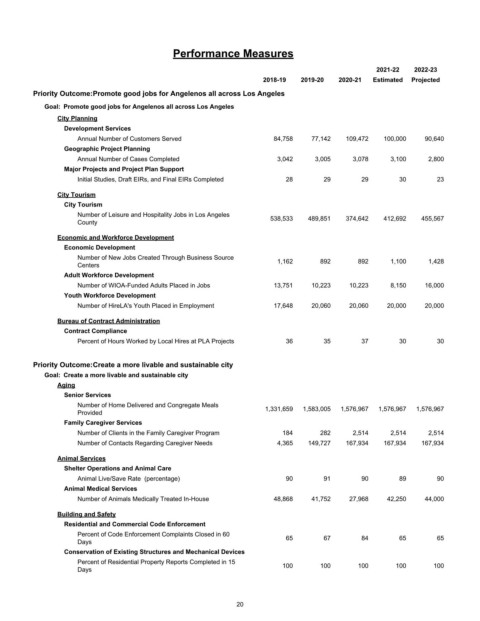
Performance Measures

                                                                                                 2021-22   2022-23
                                                                    2018-19   2019-20  2020-21  Estimated  Projected
         Priority Outcome:Promote good jobs for Angelenos all across Los Angeles
            Goal:  Promote good jobs for Angelenos all across Los Angeles
                City Planning
                 Development Services
                     Annual Number of Customers Served                 84,758   77,142   109,472   100,000   90,640
                 Geographic Project Planning
                     Annual Number of Cases Completed                   3,042    3,005     3,078     3,100    2,800
                 Major Projects and Project Plan Support
                     Initial Studies, Draft EIRs, and Final EIRs Completed  28      29       29        30        23

                City Tourism
                 City Tourism
                     Number of Leisure and Hospitality Jobs in Los Angeles  538,533  489,851  374,642  412,692  455,567
                     County

                Economic and Workforce Development
                 Economic Development
                     Number of New Jobs Created Through Business Source  1,162     892      892      1,100    1,428
                     Centers
                 Adult Workforce Development
                     Number of WIOA-Funded Adults Placed in Jobs       13,751   10,223    10,223     8,150   16,000
                 Youth Workforce Development
                     Number of HireLA's Youth Placed in Employment     17,648   20,060    20,060    20,000   20,000

                Bureau of Contract Administration
                 Contract Compliance
                     Percent of Hours Worked by Local Hires at PLA Projects  36     35       37        30        30


         Priority Outcome:Create a more livable and sustainable city
            Goal:  Create a more livable and sustainable city
                Aging
                 Senior Services
                     Number of Home Delivered and Congregate Meals
                                                                     1,331,659  1,583,005  1,576,967  1,576,967  1,576,967
                     Provided
                 Family Caregiver Services
                     Number of Clients in the Family Caregiver Program   184       282     2,514     2,514    2,514
                     Number of Contacts Regarding Caregiver Needs       4,365   149,727  167,934   167,934   167,934

                Animal Services
                 Shelter Operations and Animal Care
                     Animal Live/Save Rate  (percentage)                  90        91       90        89        90
                 Animal Medical Services
                     Number of Animals Medically Treated In-House      48,868   41,752    27,968    42,250   44,000

                Building and Safety
                 Residential and Commercial Code Enforcement
                     Percent of Code Enforcement Complaints Closed in 60  65        67       84        65        65
                     Days
                 Conservation of Existing Structures and Mechanical Devices
                     Percent of Residential Property Reports Completed in 15
                     Days                                                100       100      100       100       100


                                                             20