
Page 36 - FY 2022-23 Proposed Budget
P. 36
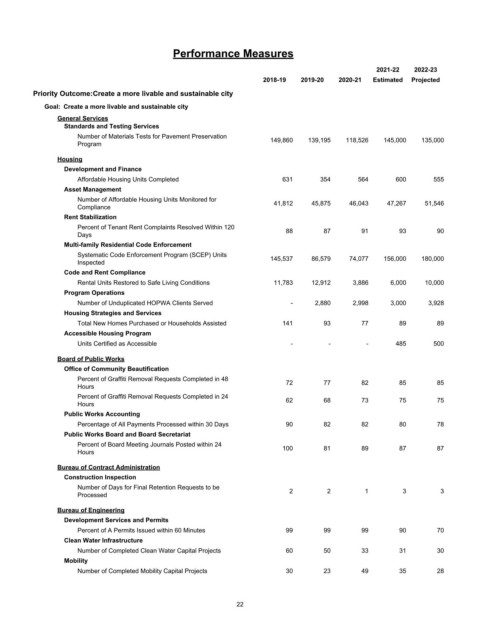
Performance Measures

                                                                                                 2021-22   2022-23
                                                                    2018-19   2019-20  2020-21  Estimated  Projected
         Priority Outcome:Create a more livable and sustainable city
            Goal:  Create a more livable and sustainable city
                General Services
                 Standards and Testing Services
                     Number of Materials Tests for Pavement Preservation  149,860  139,195  118,526  145,000  135,000
                     Program

                Housing
                 Development and Finance
                     Affordable Housing Units Completed                  631       354      564       600       555
                 Asset Management
                     Number of Affordable Housing Units Monitored for  41,812   45,875    46,043    47,267   51,546
                     Compliance
                 Rent Stabilization
                     Percent of Tenant Rent Complaints Resolved Within 120  88      87       91        93        90
                     Days
                 Multi-family Residential Code Enforcement
                     Systematic Code Enforcement Program (SCEP) Units
                                                                      145,537   86,579    74,077   156,000   180,000
                     Inspected
                 Code and Rent Compliance
                     Rental Units Restored to Safe Living Conditions   11,783   12,912     3,886     6,000   10,000
                 Program Operations
                     Number of Unduplicated HOPWA Clients Served           -     2,880     2,998     3,000    3,928
                 Housing Strategies and Services
                     Total New Homes Purchased or Households Assisted    141        93       77        89        89
                 Accessible Housing Program
                     Units Certified as Accessible                         -         -        -       485       500

                Board of Public Works
                 Office of Community Beautification
                     Percent of Graffiti Removal Requests Completed in 48  72       77       82        85        85
                     Hours
                     Percent of Graffiti Removal Requests Completed in 24
                                                                          62        68       73        75        75
                     Hours
                 Public Works Accounting
                     Percentage of All Payments Processed within 30 Days  90        82       82        80        78
                 Public Works Board and Board Secretariat
                     Percent of Board Meeting Journals Posted within 24  100        81       89        87        87
                     Hours
                Bureau of Contract Administration
                 Construction Inspection
                     Number of Days for Final Retention Requests to be
                                                                           2        2         1         3        3
                     Processed
                Bureau of Engineering
                 Development Services and Permits
                     Percent of A Permits Issued within 60 Minutes        99        99       99        90        70
                 Clean Water Infrastructure
                     Number of Completed Clean Water Capital Projects     60        50       33        31        30
                 Mobility
                     Number of Completed Mobility Capital Projects        30        23       49        35        28


                                                             22