
Page 32 - FY 2022-23 Proposed Budget
P. 32
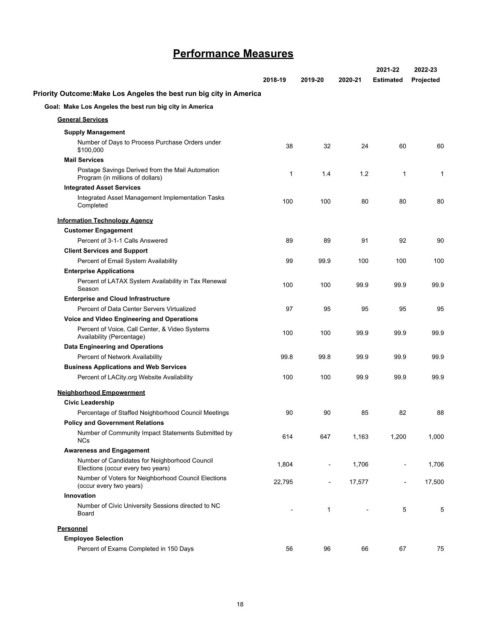
Performance Measures

                                                                                                 2021-22   2022-23
                                                                    2018-19   2019-20  2020-21  Estimated  Projected
         Priority Outcome:Make Los Angeles the best run big city in America
            Goal:  Make Los Angeles the best run big city in America

                General Services
                 Supply Management
                     Number of Days to Process Purchase Orders under      38        32       24        60        60
                     $100,000
                 Mail Services
                     Postage Savings Derived from the Mail Automation      1       1.4       1.2        1        1
                     Program (in millions of dollars)
                 Integrated Asset Services
                     Integrated Asset Management Implementation Tasks    100       100       80        80        80
                     Completed

                Information Technology Agency
                 Customer Engagement
                     Percent of 3-1-1 Calls Answered                      89        89       91        92        90
                 Client Services and Support
                     Percent of Email System Availability                 99      99.9      100       100       100
                 Enterprise Applications
                     Percent of LATAX System Availability in Tax Renewal  100      100      99.9      99.9     99.9
                     Season
                 Enterprise and Cloud Infrastructure
                     Percent of Data Center Servers Virtualized           97        95       95        95        95
                 Voice and Video Engineering and Operations
                     Percent of Voice, Call Center, & Video Systems      100       100      99.9      99.9     99.9
                     Availability (Percentage)
                 Data Engineering and Operations
                     Percent of Network Availability                     99.8     99.8      99.9      99.9     99.9
                 Business Applications and Web Services
                     Percent of LACity.org Website Availability          100       100      99.9      99.9     99.9
                Neighborhood Empowerment
                 Civic Leadership
                     Percentage of Staffed Neighborhood Council Meetings  90        90       85        82        88
                 Policy and Government Relations
                     Number of Community Impact Statements Submitted by  614       647     1,163     1,200    1,000
                     NCs
                 Awareness and Engagement
                     Number of Candidates for Neighborhood Council      1,804        -     1,706        -     1,706
                     Elections (occur every two years)
                     Number of Voters for Neighborhood Council Elections
                     (occur every two years)                           22,795        -    17,577        -    17,500
                 Innovation
                     Number of Civic University Sessions directed to NC    -        1         -         5        5
                     Board
                Personnel
                 Employee Selection
                     Percent of Exams Completed in 150 Days               56        96       66        67        75


                                                             18