
Page 35 - FY 2022-23 Proposed Budget
P. 35
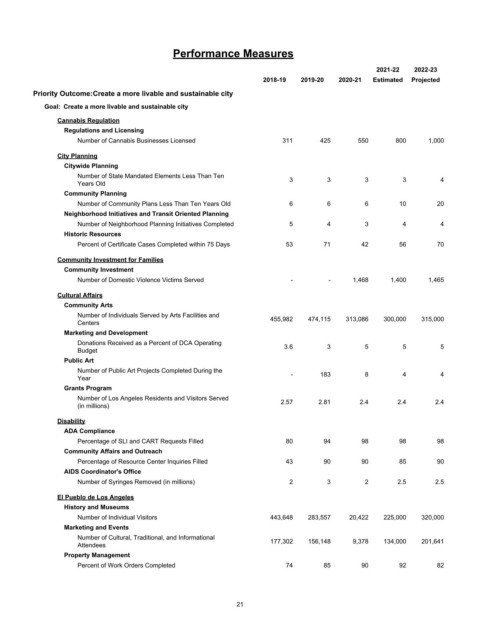
Performance Measures

                                                                                                 2021-22   2022-23
                                                                    2018-19   2019-20  2020-21  Estimated  Projected
         Priority Outcome:Create a more livable and sustainable city
            Goal:  Create a more livable and sustainable city

                Building and Safety
                Cannabis Regulation
                 Regulations and Licensing
                     Number of Cannabis Businesses Licensed              311       425      550       800     1,000
                City Planning
                 Citywide Planning
                     Number of State Mandated Elements Less Than Ten       3        3         3         3        4
                     Years Old
                 Community Planning
                     Number of Community Plans Less Than Ten Years Old     6        6         6        10        20
                 Neighborhood Initiatives and Transit Oriented Planning
                     Number of Neighborhood Planning Initiatives Completed  5       4         3         4        4
                 Historic Resources
                     Percent of Certificate Cases Completed within 75 Days  53      71       42        56        70

                Community Investment for Families
                 Community Investment
                     Number of Domestic Violence Victims Served            -         -     1,468     1,400    1,465

                Cultural Affairs
                 Community Arts
                     Number of Individuals Served by Arts Facilities and
                     Centers                                          455,982   474,115  313,086   300,000   315,000
                 Marketing and Development
                     Donations Received as a Percent of DCA Operating    3.6        3         5         5        5
                     Budget
                 Public Art
                     Number of Public Art Projects Completed During the    -       183        8         4        4
                     Year
                 Grants Program
                     Number of Los Angeles Residents and Visitors Served
                     (in millions)                                       2.57     2.81       2.4      2.4       2.4

                Disability
                 ADA Compliance
                     Percentage of SLI and CART Requests Filled           80        94       98        98        98
                 Community Affairs and Outreach
                     Percentage of Resource Center Inquiries Filled       43        90       90        85        90
                 AIDS Coordinator's Office
                     Number of Syringes Removed (in millions)              2        3         2       2.5       2.5

                El Pueblo de Los Angeles
                 History and Museums
                     Number of Individual Visitors                    443,648   283,557   20,422   225,000   320,000
                 Marketing and Events
                     Number of Cultural, Traditional, and Informational
                                                                      177,302   156,148    9,378   134,000   201,641
                     Attendees
                 Property Management
                     Percent of Work Orders Completed                     74        85       90        92        82
                General Services


                                                             21