
Page 40 - FY 2022-23 Proposed Budget
P. 40
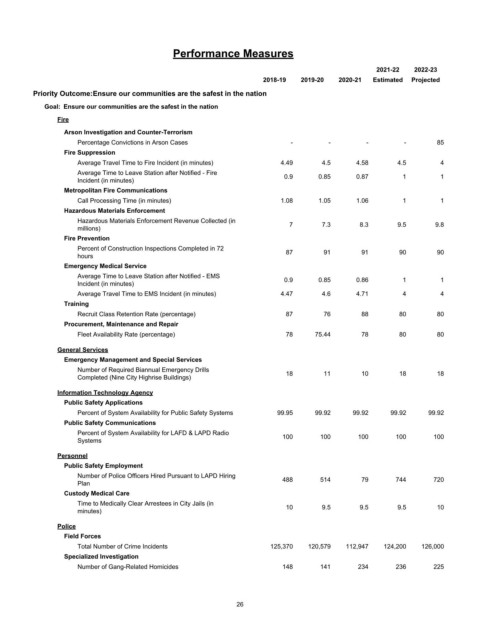
Performance Measures

                                                                                                 2021-22   2022-23
                                                                    2018-19   2019-20  2020-21  Estimated  Projected
         Priority Outcome:Ensure our communities are the safest in the nation
            Goal:  Ensure our communities are the safest in the nation

                Fire
                 Arson Investigation and Counter-Terrorism
                     Percentage Convictions in Arson Cases                 -         -        -         -        85
                 Fire Suppression
                     Average Travel Time to Fire Incident (in minutes)   4.49      4.5      4.58      4.5        4
                     Average Time to Leave Station after Notified - Fire  0.9     0.85      0.87        1        1
                     Incident (in minutes)
                 Metropolitan Fire Communications
                     Call Processing Time (in minutes)                   1.08     1.05      1.06        1        1
                 Hazardous Materials Enforcement
                     Hazardous Materials Enforcement Revenue Collected (in  7      7.3       8.3      9.5       9.8
                     millions)
                 Fire Prevention
                     Percent of Construction Inspections Completed in 72  87        91       91        90        90
                     hours
                 Emergency Medical Service
                     Average Time to Leave Station after Notified - EMS
                     Incident (in minutes)                               0.9      0.85      0.86        1        1
                     Average Travel Time to EMS Incident (in minutes)    4.47      4.6      4.71        4        4
                 Training
                     Recruit Class Retention Rate (percentage)            87        76       88        80        80
                 Procurement, Maintenance and Repair
                     Fleet Availability Rate (percentage)                 78     75.44       78        80        80
                General Services
                 Emergency Management and Special Services
                     Number of Required Biannual Emergency Drills         18        11       10        18        18
                     Completed (Nine City Highrise Buildings)
                Information Technology Agency
                 Public Safety Applications
                     Percent of System Availability for Public Safety Systems  99.95  99.92  99.92   99.92    99.92
                 Public Safety Communications
                     Percent of System Availability for LAFD & LAPD Radio  100     100      100       100       100
                     Systems
                Personnel
                 Public Safety Employment
                     Number of Police Officers Hired Pursuant to LAPD Hiring  488  514       79       744       720
                     Plan
                 Custody Medical Care
                     Time to Medically Clear Arrestees in City Jails (in  10       9.5       9.5      9.5        10
                     minutes)

                Police
                 Field Forces
                     Total Number of Crime Incidents                  125,370   120,579  112,947   124,200   126,000
                 Specialized Investigation
                     Number of Gang-Related Homicides                    148       141      234       236       225


                                                             26