
Page 38 - FY 2022-23 Proposed Budget
P. 38
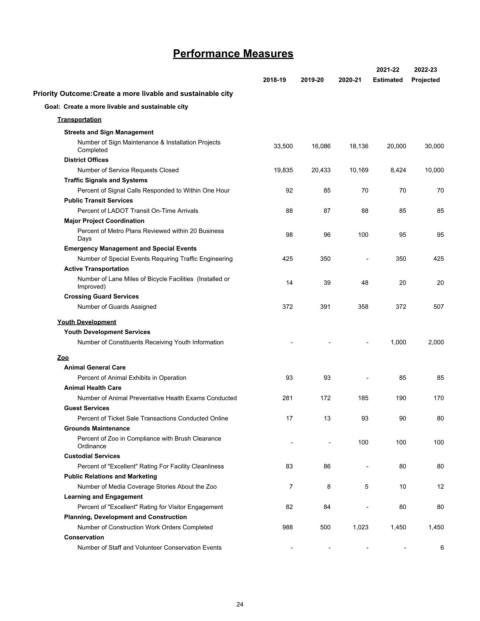
Performance Measures

                                                                                                 2021-22   2022-23
                                                                    2018-19   2019-20  2020-21  Estimated  Projected
         Priority Outcome:Create a more livable and sustainable city
            Goal:  Create a more livable and sustainable city

                Transportation
                 Streets and Sign Management
                     Number of Sign Maintenance & Installation Projects  33,500  16,086   18,136    20,000   30,000
                     Completed
                 District Offices
                     Number of Service Requests Closed                 19,835   20,433    10,169     8,424   10,000
                 Traffic Signals and Systems
                     Percent of Signal Calls Responded to Within One Hour  92       85       70        70        70
                 Public Transit Services
                     Percent of LADOT Transit On-Time Arrivals            88        87       88        85        85
                 Major Project Coordination
                     Percent of Metro Plans Reviewed within 20 Business   98        96      100        95        95
                     Days
                 Emergency Management and Special Events
                     Number of Special Events Requiring Traffic Engineering  425   350        -       350       425
                 Active Transportation
                     Number of Lane Miles of Bicycle Facilities  (Installed or  14  39       48        20        20
                     Improved)
                 Crossing Guard Services
                     Number of Guards Assigned                           372       391      358       372       507

                Youth Development
                 Youth Development Services
                     Number of Constituents Receiving Youth Information    -         -        -      1,000    2,000

                Zoo
                 Animal General Care
                     Percent of Animal Exhibits in Operation              93        93        -        85        85
                 Animal Health Care
                     Number of Animal Preventative Health Exams Conducted  281     172      185       190       170
                 Guest Services
                     Percent of Ticket Sale Transactions Conducted Online  17       13       93        90        80
                 Grounds Maintenance
                     Percent of Zoo in Compliance with Brush Clearance     -         -      100       100       100
                     Ordinance
                 Custodial Services
                     Percent of "Excellent" Rating For Facility Cleanliness  83     86        -        80        80
                 Public Relations and Marketing
                     Number of Media Coverage Stories About the Zoo        7        8         5        10        12
                 Learning and Engagement
                     Percent of "Excellent" Rating for Visitor Engagement  82       84        -        80        80
                 Planning, Development and Construction
                     Number of Construction Work Orders Completed        988       500     1,023     1,450    1,450
                 Conservation
                     Number of Staff and Volunteer Conservation Events     -         -        -         -        6


                                                             24