
Page 34 - 2020-21 Budget Summary
P. 34
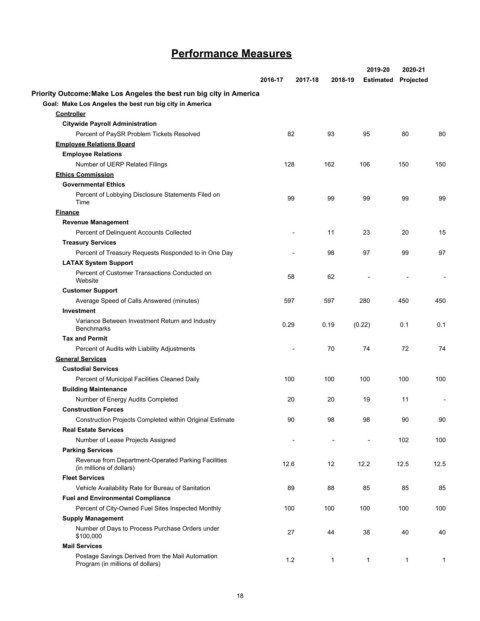
Performance Measures

                                                                                               2019-20  2020-21
                                                                   2016-17  2017-18  2018-19  Estimated Projected
         Priority Outcome:Make Los Angeles the best run big city in America
            Goal:  Make Los Angeles the best run big city in America
               Controller
                 Citywide Payroll Administration
                    Percent of PaySR Problem Tickets Resolved             82         93       95        80       80
               Employee Relations Board
                 Employee Relations
                    Number of UERP Related Filings                       128        162      106       150      150
               Ethics Commission
                 Governmental Ethics
                    Percent of Lobbying Disclosure Statements Filed on
                    Time                                                  99         99       99        99       99
               Finance
                 Revenue Management
                    Percent of Delinquent Accounts Collected                -        11       23        20       15
                 Treasury Services
                    Percent of Treasury Requests Responded to in One Day    -        98       97        99       97
                 LATAX System Support
                    Percent of Customer Transactions Conducted on
                    Website                                               58         62        -         -        -
                 Customer Support
                    Average Speed of Calls Answered (minutes)            597        597      280       450      450
                 Investment
                    Variance Between Investment Return and Industry      0.29      0.19    (0.22)      0.1       0.1
                    Benchmarks
                 Tax and Permit
                    Percent of Audits with Liability Adjustments            -        70       74        72       74
               General Services
                 Custodial Services
                    Percent of Municipal Facilities Cleaned Daily        100        100      100       100      100
                 Building Maintenance
                    Number of Energy Audits Completed                     20         20       19        11        -
                 Construction Forces
                    Construction Projects Completed within Original Estimate  90     98       98        90       90
                 Real Estate Services
                    Number of Lease Projects Assigned                       -         -        -       102      100
                 Parking Services
                    Revenue from Department-Operated Parking Facilities  12.6        12     12.2      12.5      12.5
                    (in millions of dollars)
                 Fleet Services
                    Vehicle Availability Rate for Bureau of Sanitation    89         88       85        85       85
                 Fuel and Environmental Compliance
                    Percent of City-Owned Fuel Sites Inspected Monthly   100        100      100       100      100
                 Supply Management
                    Number of Days to Process Purchase Orders under       27         44       38        40       40
                    $100,000
                 Mail Services
                    Postage Savings Derived from the Mail Automation      1.2        1         1        1         1
                    Program (in millions of dollars)


                                                             18