
Page 35 - 2020-21 Budget Summary
P. 35
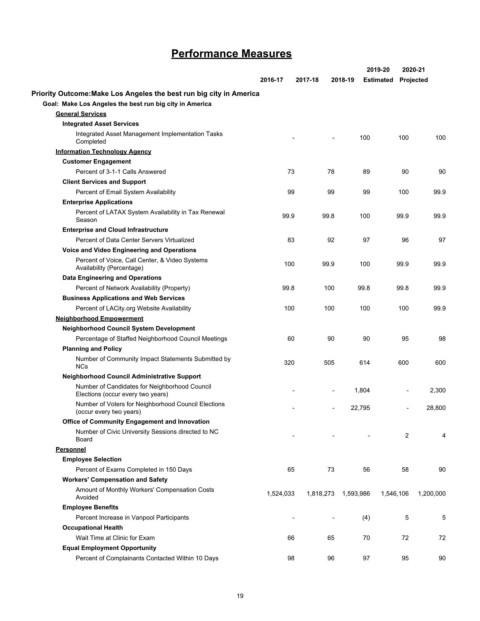
Performance Measures

                                                                                               2019-20  2020-21
                                                                   2016-17  2017-18  2018-19  Estimated Projected
         Priority Outcome:Make Los Angeles the best run big city in America
            Goal:  Make Los Angeles the best run big city in America
               General Services
                 Integrated Asset Services
                    Integrated Asset Management Implementation Tasks        -         -      100       100      100
                    Completed
               Information Technology Agency
                 Customer Engagement
                    Percent of 3-1-1 Calls Answered                       73         78       89        90       90
                 Client Services and Support
                    Percent of Email System Availability                  99         99       99       100      99.9
                 Enterprise Applications
                    Percent of LATAX System Availability in Tax Renewal  99.9      99.8      100      99.9      99.9
                    Season
                 Enterprise and Cloud Infrastructure
                    Percent of Data Center Servers Virtualized            83         92       97        96       97
                 Voice and Video Engineering and Operations
                    Percent of Voice, Call Center, & Video Systems       100       99.9      100      99.9      99.9
                    Availability (Percentage)
                 Data Engineering and Operations
                    Percent of Network Availability (Property)           99.8       100     99.8      99.8      99.9
                 Business Applications and Web Services
                    Percent of LACity.org Website Availability           100        100      100       100      99.9
               Neighborhood Empowerment
                 Neighborhood Council System Development
                    Percentage of Staffed Neighborhood Council Meetings   60         90       90        95       98
                 Planning and Policy
                    Number of Community Impact Statements Submitted by   320        505      614       600      600
                    NCs
                 Neighborhood Council Administrative Support
                    Number of Candidates for Neighborhood Council
                    Elections (occur every two years)                       -         -    1,804         -     2,300
                    Number of Voters for Neighborhood Council Elections     -         -    22,795        -    28,800
                    (occur every two years)
                 Office of Community Engagement and Innovation
                    Number of Civic University Sessions directed to NC      -         -        -        2         4
                    Board
               Personnel
                 Employee Selection
                    Percent of Exams Completed in 150 Days                65         73       56        58       90
                 Workers' Compensation and Safety
                    Amount of Monthly Workers' Compensation Costs    1,524,033  1,818,273  1,593,986  1,546,106  1,200,000
                    Avoided
                 Employee Benefits
                    Percent Increase in Vanpool Participants                -         -      (4)        5         5
                 Occupational Health
                    Wait Time at Clinic for Exam                          66         65       70        72       72
                 Equal Employment Opportunity
                    Percent of Complainants Contacted Within 10 Days      98         96       97        95       90


                                                             19