
Page 40 - 2020-21 Budget Summary
P. 40
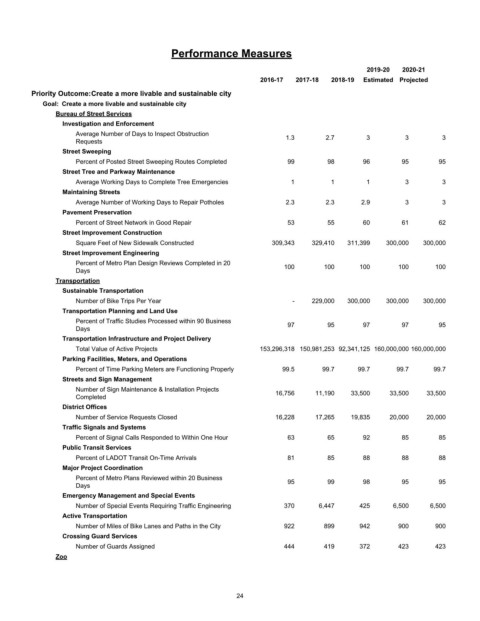
Performance Measures

                                                                                               2019-20  2020-21
                                                                   2016-17  2017-18  2018-19  Estimated Projected
         Priority Outcome:Create a more livable and sustainable city
            Goal:  Create a more livable and sustainable city
               Bureau of Street Services
                 Investigation and Enforcement
                    Average Number of Days to Inspect Obstruction         1.3       2.7        3        3         3
                    Requests
                 Street Sweeping
                    Percent of Posted Street Sweeping Routes Completed    99         98       96        95       95
                 Street Tree and Parkway Maintenance
                    Average Working Days to Complete Tree Emergencies      1         1         1        3         3
                 Maintaining Streets
                    Average Number of Working Days to Repair Potholes     2.3       2.3      2.9        3         3
                 Pavement Preservation
                    Percent of Street Network in Good Repair              53         55       60        61       62
                 Street Improvement Construction
                    Square Feet of New Sidewalk Constructed           309,343    329,410  311,399   300,000  300,000
                 Street Improvement Engineering
                    Percent of Metro Plan Design Reviews Completed in 20  100       100      100       100      100
                    Days
               Transportation
                 Sustainable Transportation
                    Number of Bike Trips Per Year                           -    229,000  300,000   300,000  300,000
                 Transportation Planning and Land Use
                    Percent of Traffic Studies Processed within 90 Business  97      95       97        97       95
                    Days
                 Transportation Infrastructure and Project Delivery
                    Total Value of Active Projects                 153,296,318 150,981,253 92,341,125 160,000,000 160,000,000
                 Parking Facilities, Meters, and Operations
                    Percent of Time Parking Meters are Functioning Properly  99.5  99.7     99.7      99.7      99.7
                 Streets and Sign Management
                    Number of Sign Maintenance & Installation Projects  16,756   11,190    33,500   33,500    33,500
                    Completed
                 District Offices
                    Number of Service Requests Closed                  16,228    17,265    19,835   20,000    20,000
                 Traffic Signals and Systems
                    Percent of Signal Calls Responded to Within One Hour  63         65       92        85       85
                 Public Transit Services
                    Percent of LADOT Transit On-Time Arrivals             81         85       88        88       88
                 Major Project Coordination
                    Percent of Metro Plans Reviewed within 20 Business    95         99       98        95       95
                    Days
                 Emergency Management and Special Events
                    Number of Special Events Requiring Traffic Engineering  370   6,447      425     6,500     6,500
                 Active Transportation
                    Number of Miles of Bike Lanes and Paths in the City   922       899      942       900      900
                 Crossing Guard Services
                    Number of Guards Assigned                            444        419      372       423      423
               Zoo


                                                             24