
Page 38 - 2020-21 Budget Summary
P. 38
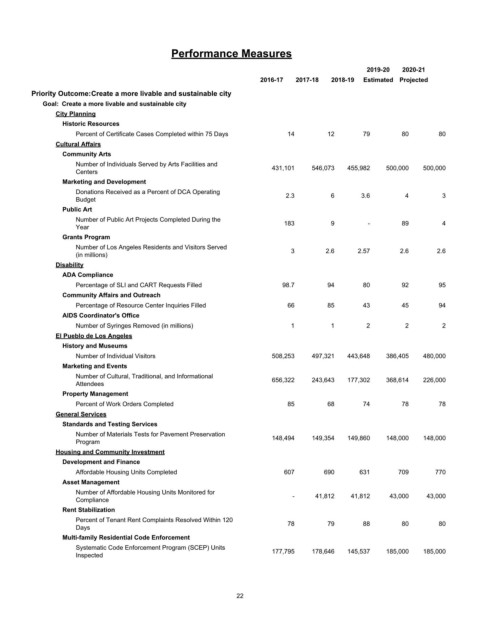
Performance Measures

                                                                                               2019-20  2020-21
                                                                   2016-17  2017-18  2018-19  Estimated Projected
         Priority Outcome:Create a more livable and sustainable city
            Goal:  Create a more livable and sustainable city
               City Planning
                 Historic Resources
                    Percent of Certificate Cases Completed within 75 Days  14        12       79        80       80
               Cultural Affairs
                 Community Arts
                    Number of Individuals Served by Arts Facilities and  431,101  546,073  455,982  500,000  500,000
                    Centers
                 Marketing and Development
                    Donations Received as a Percent of DCA Operating      2.3        6       3.6        4         3
                    Budget
                 Public Art
                    Number of Public Art Projects Completed During the
                                                                         183         9         -        89        4
                    Year
                 Grants Program
                    Number of Los Angeles Residents and Visitors Served    3        2.6     2.57       2.6       2.6
                    (in millions)
               Disability
                 ADA Compliance
                    Percentage of SLI and CART Requests Filled           98.7        94       80        92       95
                 Community Affairs and Outreach
                    Percentage of Resource Center Inquiries Filled        66         85       43        45       94
                 AIDS Coordinator's Office
                    Number of Syringes Removed (in millions)               1         1         2        2         2
               El Pueblo de Los Angeles
                 History and Museums
                    Number of Individual Visitors                     508,253    497,321  443,648   386,405  480,000
                 Marketing and Events
                    Number of Cultural, Traditional, and Informational
                                                                      656,322    243,643  177,302   368,614  226,000
                    Attendees
                 Property Management
                    Percent of Work Orders Completed                      85         68       74        78       78
               General Services
                 Standards and Testing Services
                    Number of Materials Tests for Pavement Preservation
                    Program                                           148,494    149,354  149,860   148,000  148,000
               Housing and Community Investment
                 Development and Finance
                    Affordable Housing Units Completed                   607        690      631       709      770
                 Asset Management
                    Number of Affordable Housing Units Monitored for        -    41,812    41,812   43,000    43,000
                    Compliance
                 Rent Stabilization
                    Percent of Tenant Rent Complaints Resolved Within 120  78        79       88        80       80
                    Days
                 Multi-family Residential Code Enforcement
                    Systematic Code Enforcement Program (SCEP) Units  177,795    178,646  145,537   185,000  185,000
                    Inspected


                                                             22