
Page 37 - 2020-21 Budget Summary
P. 37
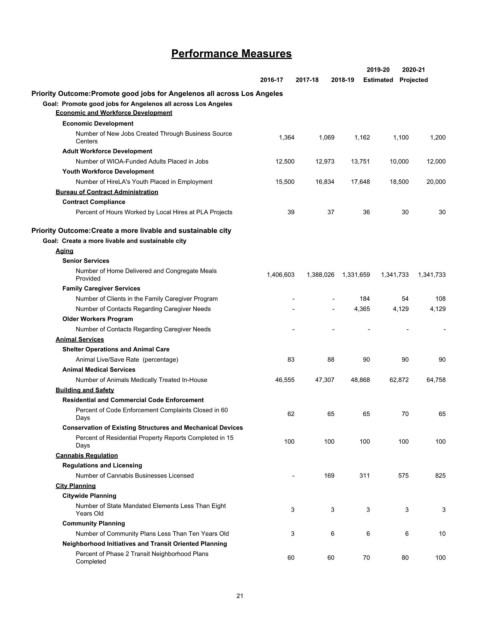
Performance Measures

                                                                                               2019-20  2020-21
                                                                   2016-17  2017-18  2018-19  Estimated Projected
         Priority Outcome:Promote good jobs for Angelenos all across Los Angeles
            Goal:  Promote good jobs for Angelenos all across Los Angeles
               Economic and Workforce Development
                 Economic Development
                    Number of New Jobs Created Through Business Source  1,364     1,069    1,162     1,100     1,200
                    Centers
                 Adult Workforce Development
                    Number of WIOA-Funded Adults Placed in Jobs        12,500    12,973    13,751   10,000    12,000
                 Youth Workforce Development
                    Number of HireLA's Youth Placed in Employment      15,500    16,834    17,648   18,500    20,000
               Bureau of Contract Administration
                 Contract Compliance
                    Percent of Hours Worked by Local Hires at PLA Projects  39       37       36        30       30

         Priority Outcome:Create a more livable and sustainable city
            Goal:  Create a more livable and sustainable city
               Aging
                 Senior Services
                    Number of Home Delivered and Congregate Meals    1,406,603  1,388,026  1,331,659  1,341,733  1,341,733
                    Provided
                 Family Caregiver Services
                    Number of Clients in the Family Caregiver Program       -         -      184        54      108
                    Number of Contacts Regarding Caregiver Needs            -         -    4,365     4,129     4,129
                 Older Workers Program
                    Number of Contacts Regarding Caregiver Needs            -         -        -         -        -
               Animal Services
                 Shelter Operations and Animal Care
                    Animal Live/Save Rate  (percentage)                   83         88       90        90       90
                 Animal Medical Services
                    Number of Animals Medically Treated In-House       46,555    47,307    48,868   62,872    64,758
               Building and Safety
                 Residential and Commercial Code Enforcement
                    Percent of Code Enforcement Complaints Closed in 60   62         65       65        70       65
                    Days
                 Conservation of Existing Structures and Mechanical Devices
                    Percent of Residential Property Reports Completed in 15  100    100      100       100      100
                    Days
               Cannabis Regulation
                 Regulations and Licensing
                    Number of Cannabis Businesses Licensed                  -       169      311       575      825
               City Planning
                 Citywide Planning
                    Number of State Mandated Elements Less Than Eight      3         3         3        3         3
                    Years Old
                 Community Planning
                    Number of Community Plans Less Than Ten Years Old      3         6         6        6        10
                 Neighborhood Initiatives and Transit Oriented Planning
                    Percent of Phase 2 Transit Neighborhood Plans         60         60       70        80      100
                    Completed


                                                             21