
Page 42 - 2020-21 Budget Summary
P. 42
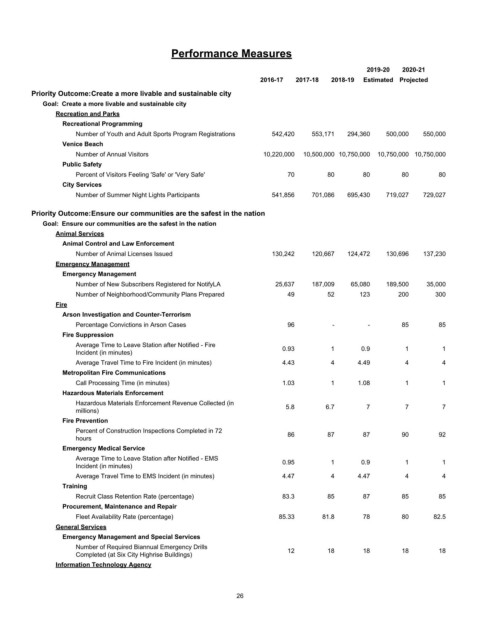
Performance Measures

                                                                                               2019-20  2020-21
                                                                   2016-17  2017-18  2018-19  Estimated Projected
         Priority Outcome:Create a more livable and sustainable city
            Goal:  Create a more livable and sustainable city
               Recreation and Parks
                 Recreational Programming
                    Number of Youth and Adult Sports Program Registrations  542,420  553,171  294,360  500,000  550,000
                 Venice Beach
                    Number of Annual Visitors                       10,220,000  10,500,000 10,750,000  10,750,000 10,750,000
                 Public Safety
                    Percent of Visitors Feeling 'Safe' or 'Very Safe'     70         80       80        80       80
                 City Services
                    Number of Summer Night Lights Participants        541,856    701,086  695,430   719,027  729,027

         Priority Outcome:Ensure our communities are the safest in the nation
            Goal:  Ensure our communities are the safest in the nation
               Animal Services
                 Animal Control and Law Enforcement
                    Number of Animal Licenses Issued                  130,242    120,667  124,472   130,696  137,230
               Emergency Management
                 Emergency Management
                    Number of New Subscribers Registered for NotifyLA  25,637    187,009   65,080   189,500   35,000
                    Number of Neighborhood/Community Plans Prepared       49         52      123       200      300
               Fire
                 Arson Investigation and Counter-Terrorism
                    Percentage Convictions in Arson Cases                 96          -        -        85       85
                 Fire Suppression
                    Average Time to Leave Station after Notified - Fire
                    Incident (in minutes)                                0.93        1       0.9        1         1
                    Average Travel Time to Fire Incident (in minutes)    4.43        4      4.49        4         4
                 Metropolitan Fire Communications
                    Call Processing Time (in minutes)                    1.03        1      1.08        1         1
                 Hazardous Materials Enforcement
                    Hazardous Materials Enforcement Revenue Collected (in  5.8      6.7        7        7         7
                    millions)
                 Fire Prevention
                    Percent of Construction Inspections Completed in 72   86         87       87        90       92
                    hours
                 Emergency Medical Service
                    Average Time to Leave Station after Notified - EMS   0.95        1       0.9        1         1
                    Incident (in minutes)
                    Average Travel Time to EMS Incident (in minutes)     4.47        4      4.47        4         4
                 Training
                    Recruit Class Retention Rate (percentage)            83.3        85       87        85       85
                 Procurement, Maintenance and Repair
                    Fleet Availability Rate (percentage)                85.33      81.8       78        80      82.5
               General Services
                 Emergency Management and Special Services
                    Number of Required Biannual Emergency Drills
                    Completed (at Six City Highrise Buildings)            12         18       18        18       18
               Information Technology Agency


                                                             26